Welcome back everyone! Let’s continue learning from where we stopped the last time.
If you are following the blog closely, you should understand what exchange rate, pip, ask and bid prices, spread and positions mean by now. We will be taking it a step further today. Sit back, grab your popcorn and learn.
- Fundamental Analysis
Fundamental analysis is a method of analyzing the financial market with the aim of price forecasting. It focuses on the overall state of the economy and uses various factors including interest rates, employment rate, GDP, international trade and manufacturing, as well as their relative impact on the value of the national currency they relate to. It is therefore safe to say that fundamental analysis is the major determinant of price fluctuations and so it is important to understand how these factors affect price. For example, the Non-Farm Payroll news that comes up on the first Friday of every month.
2. Technical Analysis
Unlike the fundamental analysis, technical analysis make use of chart patterns and trends, support and resistance levels, and price and volume behavior to identify trading opportunities with positive expectancy. TA does not consider the underlying and intrinsic factors, or the economics that affect the price of a currency. Technical Analysis is often used to generate short-term trading signals from various charting tools.
3. Trends
Trend is the tendency of the price of a currency to move in a particular direction over a period (long or short term). Trends can be upward, in which price move in an upward direction over a period of time; downward in which price move in an upward direction over a period of time; or even sideways where price moves in a range over a period of time.
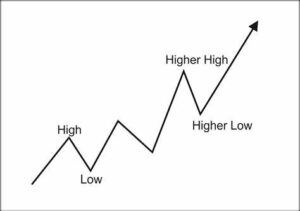
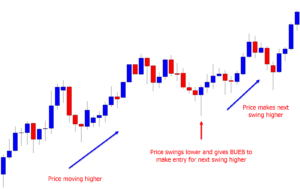
- Uptrend
An uptrend describes the price movement of a financial asset whose overall direction is upward i.e., it depicts an overall increase in price. In an uptrend, each consecutive peak is higher than the previous. The uptrend is therefore composed of higher highs and higher lows. So far the price is making these higher swing lows and higher swing highs, the uptrend is considered intact, and considered broken if otherwise. In an uptrend, traders usually look for opportunities to go bullish in the forex market.
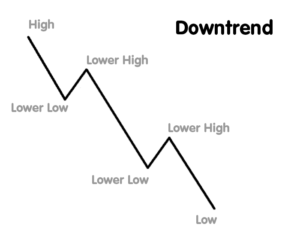
- Downtrend
As opposed to the uptrend, a downtrend is a gradual reduction in the price or value of a financial asset. It depicts an overall decrease in price. Downtrends are characterized by lower highs and lower lows over time. So far the price is making lower swing highs and lower swing lows, the uptrend is considered intact, and considered broken if otherwise. During a downtrend, traders usually find opportunity to go bearish in the forex market.
4.Support and Resistance
Prices move because of supply and demand. When demand is greater than supply, price rises, and price falls if otherwise. Sometimes, prices will move sideways as both supply and demand are in equilibrium.
In simple terms, Support occurs when falling prices stop, change direction, and begin to rise. Support is often viewed as a “floor” or “foundation” which is or holding up, prices. On the other hand, Resistance is a price level where rising prices stop, change direction, and begin to fall. Resistance is often viewed as a “ceiling” or “roof” keeping prices from rising higher.
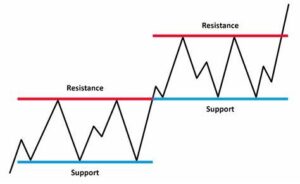
If price breaks a support or a resistance, the price usually continue to the next level of support or resistance. Support and resistance levels are not usually points, rather they are a zone covering a small range of prices so levels can be breached, or pierced, without necessarily being broken. As a result, support/resistance levels help identify possible areas where price may change directions.
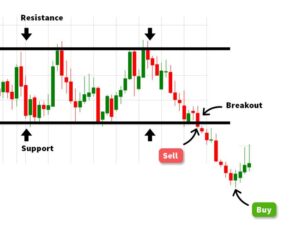
As shown in the image above, we can see both the resistance and support zones, price kept trying to break the zones with the wicks on the candlesticks (Note: we will discuss wicks and candlesticks shortly). The wicks were however, fake breakouts and so an impatient trader using the support and resistance trading strategy may have believed that the resistance or support has been broken. At the point of breakout however, we can see that the bearish candlestick that broke the support closed below the support and the price headed to a new support level.