Welcome back
STOCHASTIC INDICATOR
A stochastic indicator is a technical analysis tool that uses historical price and volume data to predict future price movements. It is based on the idea that prices tend to close near their highs in an uptrend and near their lows in a downtrend. The term “stochastic” refers to the use of a random or probability-based approach to generate the indicator. There are several different types of stochastic indicators, including the Fast Stochastic Oscillator and the Slow Stochastic Oscillator. These indicators can be used in conjunction with other technical analysis tools to help traders make more informed decisions about when to buy and sell securities.
The fast stochastic oscillator
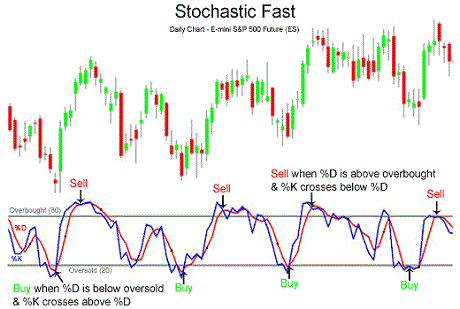
The Fast Stochastic Oscillator is a momentum indicator that compares the most recent closing price of a security to its price range over a given period of time. It is calculated using the following formula: %K = (Current Close – Lowest Low)/(Highest High – Lowest Low) * 100 %D = 3-day SMA of %K
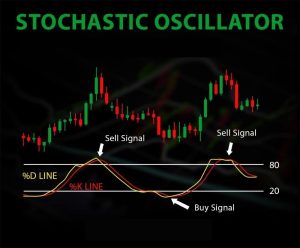
The %K line is the main line, and the %D line is a smoothed moving average of the %K line. The Fast Stochastic Oscillator can be used to identify potential overbought or oversold conditions in the market, as well as to generate buy and sell signals. When the %K line crosses above the %D line, it is often seen as a buy signal, and when the %K line crosses below the %D line, it is often seen as a sell signal. It is important to note, however, that the Fast Stochastic Oscillator should not be used in isolation, but rather as part of a broader technical analysis strategy.
The fast stochastic oscillator
The Slow Stochastic Oscillator is a momentum indicator that is similar to the Fast Stochastic Oscillator, but it uses a longer period of time to calculate the %K and %D lines. The formula for calculating the Slow Stochastic Oscillator is the same as the Fast Stochastic Oscillator, but the time period used for the calculation is longer. For example, the Slow Stochastic Oscillator might use a 14-day time period, while the Fast Stochastic Oscillator might use a 3-day time period.
Like the Fast Stochastic Oscillator, the Slow Stochastic Oscillator can be used to identify potential overbought or oversold conditions in the market, as well as to generate buy and sell signals. However, because it uses a longer time period, the Slow Stochastic Oscillator tends to be less sensitive to short-term price movements and may provide a more stable view of the market. As with all technical analysis tools, it is important to use the Slow Stochastic Oscillator in conjunction with other indicators and not rely on it in isolation.
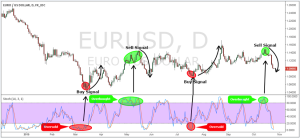
How to trade the stochastic oscillator
Simply put, when the stochastic moving averages are above the 80 line, we’re in the overbought territory. Conversely, when the stochastic moving averages are below the 20 line, we’re in oversold territory.