Harmonic price patterns are powerful tools used by forex traders to identify potential trend reversals or continuation patterns in the market. These patterns are based on the concept of Fibonacci ratios and offer traders a systematic approach to analyzing price movements and making informed trading decisions.
One of the most well-known harmonic price patterns is the Gartley pattern. This pattern consists of a series of price swings that form specific Fibonacci ratios. The key ratios used in the Gartley pattern are 0.618 and 0.382, derived from the Fibonacci sequence. When these ratios align with specific price swings, a potential trading opportunity may be present.
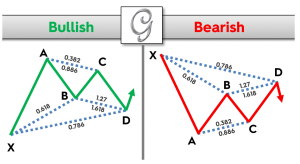
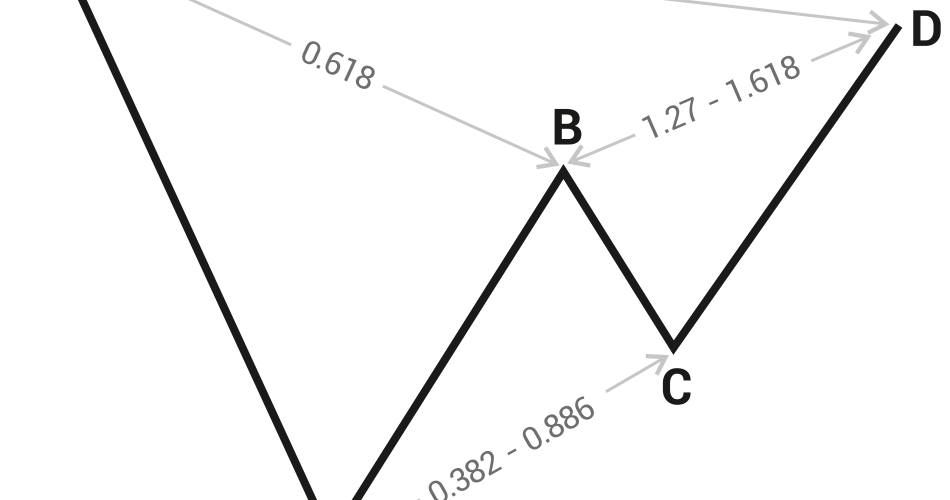
The Gartley pattern follows a distinct structure. It starts with an initial price swing, known as the XA leg. This leg is followed by a retracement, represented by the AB leg, which typically retraces 61.8% of the XA leg. The BC leg then moves in the opposite direction of the AB leg, typically retracing between 38.2% and 88.6% of the AB leg. Finally, the CD leg completes the pattern by extending beyond the XA leg and often retraces 127.2% or 161.8% of the BC leg.
By identifying and correctly interpreting the Gartley pattern, traders can anticipate potential reversal zones and plan their entries and exits accordingly. Traders typically look for additional confluence factors, such as support and resistance levels, trendlines, or Fibonacci extensions, to confirm the validity of the pattern.
Another commonly observed harmonic price pattern is the Butterfly pattern. Similar to the Gartley pattern, the Butterfly pattern also incorporates Fibonacci ratios. However, the ratios used in this pattern differ slightly. The key ratios for the Butterfly pattern are 0.786 and 1.272.
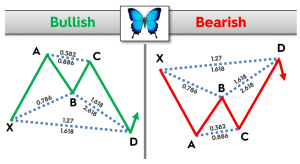
The Butterfly pattern consists of an initial price swing, known as the XA leg, followed by a retracement, represented by the AB leg. The BC leg then moves in the opposite direction of the AB leg and typically retraces between 38.2% and 88.6% of the AB leg. The final leg, CD, extends beyond the XA leg and often reaches the 1.272 Fibonacci extension of the BC leg.
Like the Gartley pattern, traders analyze the Butterfly pattern to identify potential reversal zones and plan their trades accordingly. They consider other technical factors, such as candlestick patterns, momentum indicators, or volume analysis, to confirm the pattern’s validity and improve their trading decisions.
It is important to note that while harmonic price patterns offer valuable insights into potential market reversals or continuation patterns, they are not foolproof. Traders should always use proper risk management techniques, including setting stop-loss orders and managing position sizes, to protect themselves from unexpected market movements.
In conclusion, harmonic price patterns provide forex traders with a systematic approach to analyzing market trends and potential reversal or continuation zones. By identifying specific Fibonacci ratios within price swings, such as in the Gartley or Butterfly patterns, traders can enhance their trading strategies and make more informed decisions. However, it is essential to combine harmonic patterns with other technical analysis tools and risk management techniques for a well-rounded trading approach.