Welcome back!
Williams %R indicator
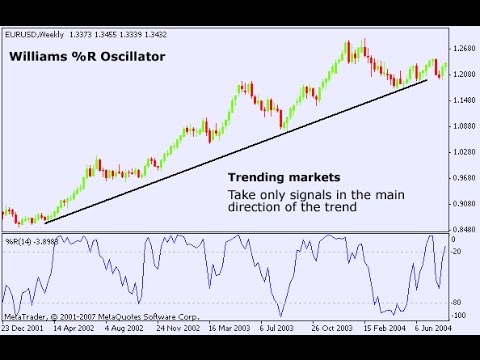
The Williams %R (also known as the Williams Percent Range) is a technical indicator that measures overbought and oversold levels in a stock or other financial instrument. It is similar to the Relative Strength Index (RSI) in that it compares the magnitude of recent gains to recent losses, but it is calculated differently. The Williams %R is a momentum indicator that compares the current closing price to the highest high and the lowest low over a specified period of time.

The Williams %R is calculated by taking the current closing price, subtracting the highest high over the specified period of time, and then dividing that number by the difference between the highest high and the lowest low over the specified period of time. The result is then multiplied by -100 to give a value between -100 and 0. A value of -100 indicates that the stock or other financial instrument is oversold, while a value of 0 indicates that it is overbought.
Trading strategies
- Overbought/Oversold
The Williams %R is typically used as a momentum indicator to help traders identify overbought and oversold conditions. When the Williams %R is above -20, it is considered overbought, and when it is below -80, it is considered oversold. However, it’s important to note that these levels are not absolute and that other technical analysis tools and indicators should be used in conjunction with the Williams %R to make a trading decision.
2. Position entry
The Williams %R can also be used to generate buy and sell signals. If the Williams %R falls below -80, it can be a signal to buy, while if it rises above -20, it can be a signal to sell. However, it’s important to note that these signals are not always accurate and that they should be used in conjunction with other technical analysis tools and indicators.

The Williams %R indicator is a versatile tool that can be used in a variety of time frames, from short-term trading to long-term investing. It can be used in any market, whether it is a stock, commodity, currency, or bond market. However, it’s always important to keep in mind that the Williams %R is a lagging indicator, meaning it will only signal a change in trend after it has already occurred.
In conclusion, the Williams %R is a momentum indicator that is used to measure overbought and oversold levels in a stock or other financial instrument. It can be used to identify trends and generate buy and sell signals, but it should be used in conjunction with other technical analysis tools and indicators, and with fundamental analysis. Additionally, past performance is not indicative of future performance, so it’s always important to do your own research and make your own investment decisions.