Welcome back!
Donchian Channel Indicator
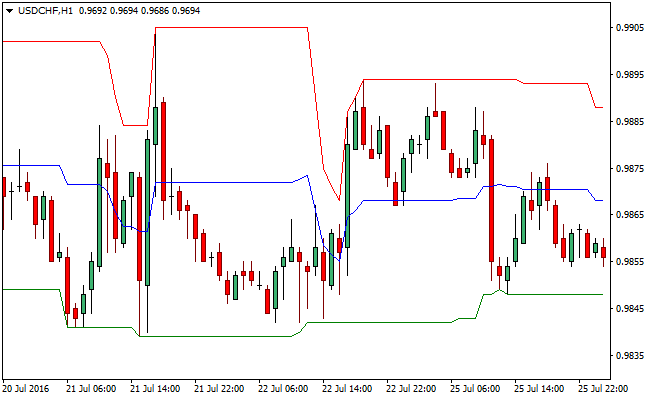
The Donchian Channel indicator is a technical analysis tool that is used to identify trends and potential entry and exit points in a stock or other financial instrument. The Donchian Channel indicator plots two lines on a chart, one representing the highest high and the other representing the lowest low over a specified period of time.

The Donchian Channel is calculated by taking the highest high and the lowest low over a specified period of time, typically 20 days, and plotting them on a chart. The highest high line represents the upper channel and the lowest low line represents the lower channel. The space between the two lines represents the price range over the specified period of time. The Donchian channel can be used as a trend-following indicator by traders to identify trends, and to enter and exit trades. A breakout above the upper channel can be interpreted as a signal to buy, while a breakout below the lower channel can be interpreted as a signal to sell.

The Donchian channel can also be used as a volatility indicator by traders. The space between the upper and lower channel represents the volatility of the stock or other financial instrument over the specified period of time. A stock or other financial instrument that has a wide channel is considered to be more volatile than one that has a narrow channel.
In addition, traders can also use the Donchian channel to identify support and resistance levels. The upper channel can be used as a resistance level and the lower channel can be used as a support level. Traders can use these levels to set stop-loss orders or to take profit.
It’s important to note that the Donchian channel is a lagging indicator, meaning it will only signal a change in trend after it has already occurred. Additionally, the Donchian channel should be used in conjunction with other technical analysis tools and indicators, and with fundamental analysis. It’s also important to note that past performance is not indicative of future performance, so it’s always important to do your own research and make your own investment decisions.
In conclusion, the Donchian Channel indicator is a technical analysis tool that is used to identify trends and potential entry and exit points in a stock or other financial instrument. It can also be used as a volatility indicator, and to identify support and resistance levels. However, it is a lagging indicator, and should be used in conjunction with other technical analysis tools and indicators, and with fundamental analysis. Additionally, past performance is not indicative of future performance, so it’s always important to do your own research and make your own investment decisions.
